Microsoft has banned this popular performance index from the control panel for PCs running Windows 8.1 or later. We will show you how to find that performance index anyways and help you interpreting it the right way.
What is the Windows Experience Index (WEI)?
Introduced with Windows Vista, the Windows Experience Index (WEI) shows at a glance how fast your computer is working and which hardware shortcomings it may have. Before Windows 8.1 you were able to view the Windows Performance Index via the control panel. But even under Windows 10 the Windows Experience Index is still available. The Windows Experience Index is computed on a scale from 1.0 for the worst performance score to 9.9 for particularly high-performing computers by the so called Windows System Assessment Tool (WinSAT). As a performance index for your PC it is a practical indicator to evaluate quickly the processing power of your machine. While being a simple numeric score as an overall grade, Windows 10 calculates the WEI score based on the lowest score of four sub-ratings. Those exist for RAM, graphic-chipset or GPU and hard disk. The Windows 10 Experience Index thus assumes that poor performance in one sub-category slows down the computer considerably, even though performant hardware might be installed elsewhere. While that makes really an accurate measure, the Windows 10 Windows Experience Index might help reveal and possibly eliminate serious weaknesses of your PC. Here’s how you can get the WEI score with Windows 10..
How to get the Windows 10 Experience Index (WEI)
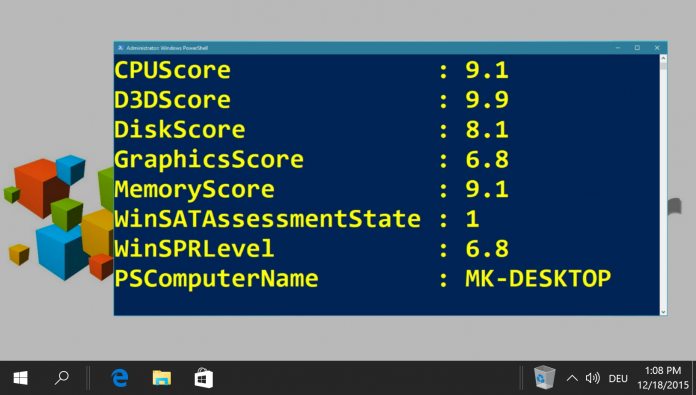
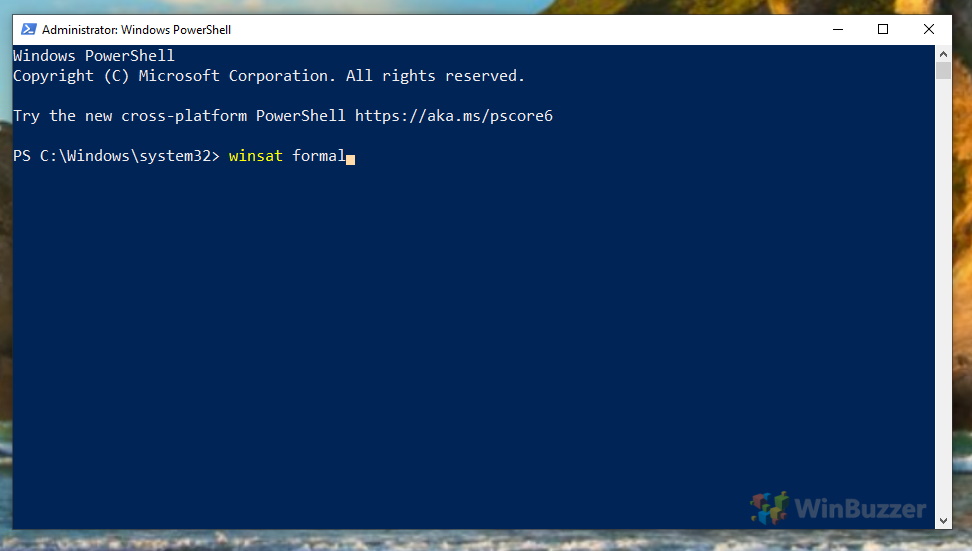
Right-click the start button to open the context menu and click on “Windows PowerShell (Admin)”. There, run the command “winsat formal” to calculate the Windows Experience Index (WEI) score with the Windows System Assessment Tool (WinSAT). If your PowerShell-window closes automatically, just open it again as shown in the first step. You can now display the Windows Experience Index (WEI) score using the command “Get-WmiObject -Class Win32_WinSAT”. Windows 10 will show you the following six values. CPUScore = processor performance in calculations per second D3DScore = 3D graphics performance DiskScore = Data transfer rate of the primary hard disk Graphicsscore = Graphics desktop performance for Windows (Aero) MemoryScore = working memory (RAM) – memory operations per second WinSPRLevel = overall rating (corresponds to the lowest partial rating)


